Build Your Own War Room: How a Personal Performance Dashboard Gives Everyday Athletes a Pro-Level Edge
Picture the situation room inside an NBA front office or an NFL training facility. Screens everywhere. Numbers updating in real time. Analysts pulling trends out of data that nobody else even thought to collect. It looks expensive, exclusive, and completely out of reach for the average person grinding through early morning runs or Saturday morning rec league games.
Except it's not. Not anymore.
The tools that power elite athletic performance have quietly trickled down to the consumer level, and most people aren't taking full advantage of them. If you're wearing a fitness tracker, logging workouts in an app, or even just keeping a rough journal of your training sessions, you already have the raw ingredients for your own performance dashboard. You just need to put them together in a way that actually shows you something useful.
Here at Goal289, we're obsessed with the idea that tracking every rep and owning every result isn't reserved for the pros. This is your guide to building the system that makes that real.
What a Performance Dashboard Actually Is (And Isn't)
Let's clear something up right away. A performance dashboard isn't a fancy app that does the thinking for you. It's a centralized view of your most important training metrics, organized in a way that makes trends visible at a glance.
Think of it less like a scoreboard and more like a cockpit. A pilot doesn't stare at one gauge — they scan multiple instruments simultaneously to get a complete picture of what's happening. Your dashboard works the same way. Heart rate trends, weekly volume, sleep quality, perceived effort, personal records — all of it in one place, updated regularly, and reviewed with intention.
The goal isn't to collect more data. It's to collect the right data and actually look at it.
Step One: Decide Which Metrics Actually Matter for You
This is where most people go wrong. They try to track everything, get overwhelmed, and end up tracking nothing consistently. Start narrow.
For most amateur athletes and fitness enthusiasts, a solid starting point includes:
- Volume — total miles, reps, or minutes per week depending on your sport
- Intensity — average heart rate, perceived exertion (RPE), or pace zones
- Recovery markers — resting heart rate, HRV (if your device tracks it), and sleep duration
- Performance benchmarks — your key personal records or goal-specific metrics, like a 5K time or max squat
- Consistency score — how many planned sessions you actually completed
That last one is underrated. A lot of people track what they do when they show up, but never audit how often they actually show up. Consistency is the foundation that makes every other metric meaningful.
If you're a runner, you might add weekly mileage breakdown by zone. If you're a lifter, you might track tonnage (total weight moved). If you're a weekend cyclist, average power output might be your north star. The point is to pick the numbers that are specific to your goals, not just the ones your app happens to surface by default.
Step Two: Pick Your Tools (You Don't Need Anything Fancy)
Here's the beautiful part: Google Sheets is free, and it can do almost everything you need.
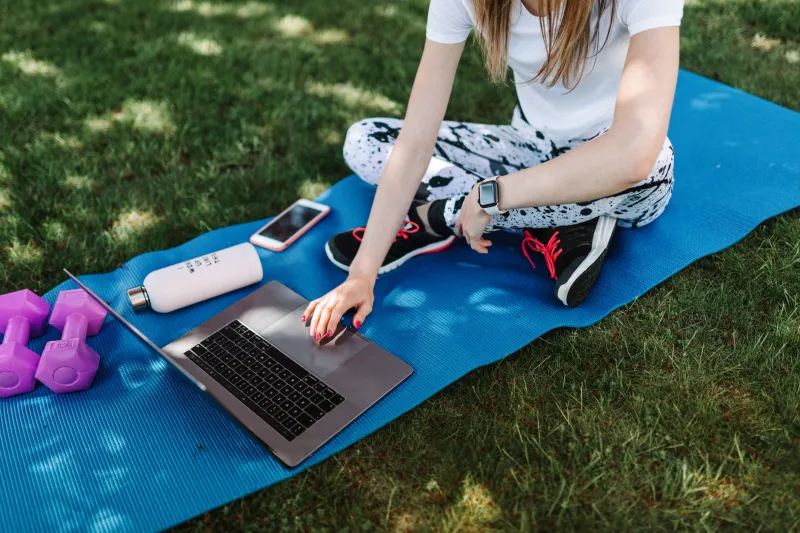
Seriously. A well-structured spreadsheet with a few simple charts will outperform a flashy app you barely understand. If you want something more visual right out of the box, platforms like Strava, TrainingPeaks, Garmin Connect, or Apple Fitness+ have built-in dashboard features that pull from your device data automatically.
For a hybrid approach — one that a lot of serious amateur athletes swear by — try this:
- Let your wearable or app collect the raw data automatically
- Pull the key numbers into a weekly log in Google Sheets or Notion
- Build simple line or bar charts to visualize trends over 4–8 week blocks
- Add a short weekly notes column where you flag anything unusual — a bad night's sleep, a stressful week at work, a nagging knee
That last column is more important than it sounds. Quantitative data tells you what happened. Qualitative notes help you understand why. When your performance dips three weeks in a row, you want to know whether it's overtraining, under-recovery, life stress, or just a bad stretch of motivation. Your numbers alone won't tell you that story — but your notes will.
Step Three: Review on a Schedule, Not a Whim
A dashboard you never look at is just a filing cabinet. The review cadence matters as much as the data itself.
Here's a simple rhythm that works:
- Weekly check-in (5–10 minutes): Log the week's numbers. Flag anything that stands out. Note how you felt overall.
- Monthly review (20–30 minutes): Look at your trend lines. Are you progressing? Stalling? Overreaching? Compare this month to last month.
- Quarterly audit (1 hour): Step back and look at the big picture. Are your goals still the right goals? Does your training reflect your priorities? What needs to change?
This isn't about obsessing over every data point. It's about building the habit of paying attention — which is something most recreational athletes never actually do in a structured way.
What the Data Will Show You That Your Gut Never Would
Here's the thing about human perception: we're terrible at spotting gradual trends. We notice dramatic changes — a personal best, a bad injury, a week where everything clicks. But the slow creep of fatigue accumulation? The subtle correlation between poor sleep and flat performance? The pattern of always underperforming in week three of a training block? We miss that stuff completely.
Visual data catches it.
One runner who started logging her data consistently noticed that her pace in the back half of her long runs had been slipping for six straight weeks — not dramatically, just a little each time. She'd written it off as normal variation. The trend line told a different story: she was accumulating fatigue faster than she was recovering. She adjusted her easy-day pacing, added one more rest day per week, and within a month her long run splits were back on track.
That's not a sports science breakthrough. That's just looking at your numbers.
You Already Have More Data Than You Think
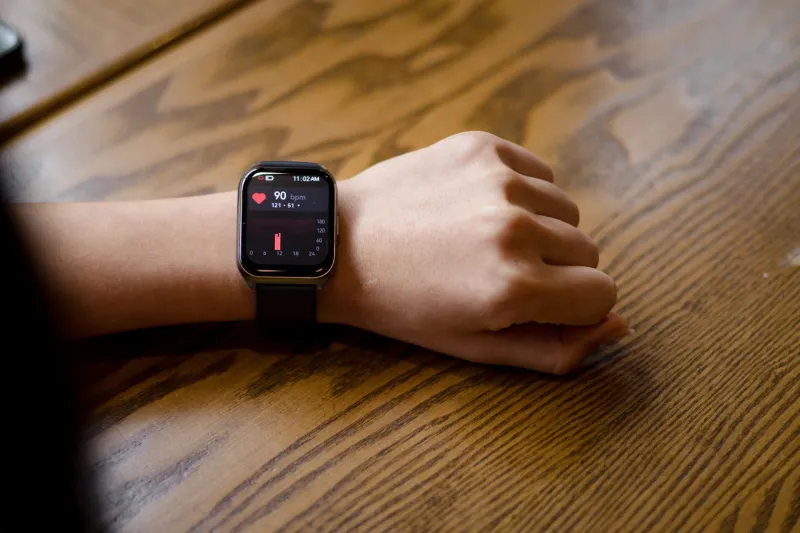
If you've been wearing a fitness tracker for more than a few months, you're sitting on a goldmine of personal performance data that you've probably never fully explored. Most people glance at their step count and move on. But buried in that history are trends about your sleep, your activity patterns, your resting heart rate over time — all of it waiting to tell you something useful.
Start there. Pull the last 90 days of data from whatever app you're already using. Look at it as a chart, not a number. See what jumps out.
You might be surprised what you've been missing.
The pro teams didn't build their analytics infrastructure overnight, and you don't have to either. Start with one metric. Track it consistently. Review it regularly. Add another metric when the first one feels automatic. Over time, you'll have a system that reflects exactly how you train, what you respond to, and where you have room to grow.
That's not a cheat code. That's just what it looks like when you actually pay attention — and it changes everything.