The Fitness Stats You're Ignoring Are the Ones That Actually Matter
The Fitness Stats You're Ignoring Are the Ones That Actually Matter
Open any fitness app right now. Odds are the first thing you see is a calorie burn total, a step count, or maybe a colorful ring telling you how "active" you've been. These numbers are front and center because they're easy to understand, easy to visualize, and — let's be real — they feel good when they go up.
But if you ask a serious performance coach which metrics they'd actually stake an athlete's progress on, most of those flashy dashboard stats don't even make the list.
Here's the uncomfortable truth: the fitness industry has optimized for engagement, not for insight. And for US athletes trying to break through plateaus, avoid injury, and build sustainable performance, that gap between what's popular and what's predictive is costing real results.
Why the Popular Metrics Fall Short
Calorie counts are notoriously inaccurate — some research suggests wearables can miss the mark by 20 to 40 percent depending on the activity and the individual. Step counts tell you about movement volume but say nothing about movement quality, intensity distribution, or recovery status. Even VO2 max estimates, which apps love to feature, are algorithmically generated approximations that can shift based on something as simple as whether you wore your device on your dominant wrist.
None of this means those numbers are worthless. But treating them as your primary performance indicators is like judging a car's mechanical health by how clean it looks on the outside.
Heart Rate Variability: The Metric Coaches Actually Swear By
If there's one underutilized data point that keeps coming up in conversations with performance coaches, it's heart rate variability — commonly abbreviated as HRV.
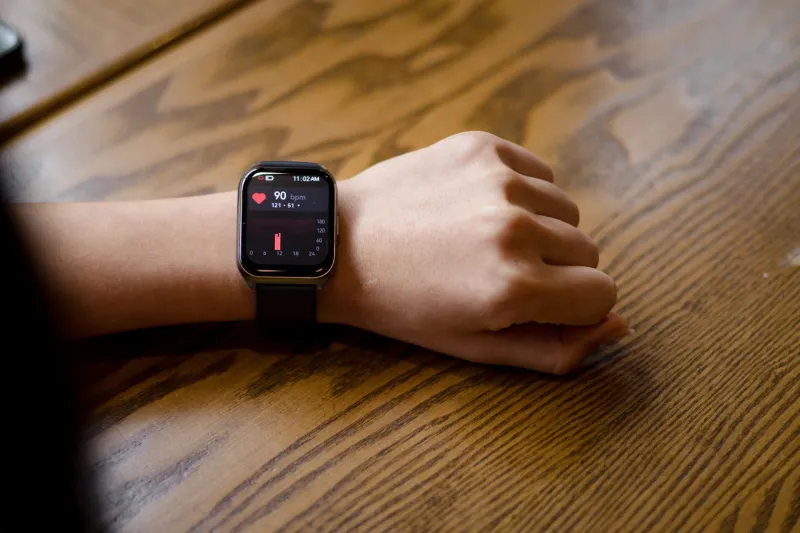
HRV measures the variation in time between consecutive heartbeats. A higher HRV generally indicates a well-recovered, adaptable nervous system. A sudden drop in your baseline HRV is often an early warning sign of overtraining, illness, or accumulated stress — sometimes days before you feel it.
"HRV is the closest thing we have to a daily readiness score," says one strength and conditioning coach who works with collegiate athletes in the Midwest. "When an athlete's HRV tanks two days in a row, we don't push. That data has prevented more injuries than any training modification we've made."
The good news: you don't need a $500 chest strap to track it. Apps like HRV4Training let you measure it with just your phone's camera in about 60 seconds each morning. Several consumer wearables, including newer Garmin and Polar models, now include HRV tracking as a standard feature.
Training Monotony: Are You Actually Varying Your Load?
Here's a metric almost no mainstream fitness app surfaces: training monotony score. It sounds technical, but the concept is straightforward — it measures how similar your training days are to each other over a given period.
High training monotony means you're basically doing the same thing day after day at roughly the same intensity. That's a recipe for staleness, overuse injuries, and performance plateaus. Low-to-moderate monotony suggests you're varying your effort levels appropriately, which is how adaptation actually happens.
The formula, developed by exercise physiologist Andrew Foster, uses your average daily training load divided by the standard deviation of that load. You can calculate it manually in a spreadsheet if you're logging your workouts, or look for platforms that surface this kind of periodization data.
If you've been grinding the same 45-minute moderate-intensity cardio session five times a week and wondering why you've stopped improving — training monotony is likely a big part of the answer.
Recovery Ratios: Work Is Only Half the Equation
Most tracking platforms are built around logging effort. How many miles did you run? How many sets did you lift? How many active minutes did you accumulate? What they consistently underemphasize is the other side of the performance equation: recovery.
Recovery ratios — the relationship between your training load and your actual recovery inputs like sleep quality, resting heart rate trends, and perceived soreness — are what determine whether your hard work is building you up or breaking you down.
Some advanced platforms like Whoop and Garmin's Body Battery feature do attempt to model this, but even then, users often ignore the recovery scores in favor of the activity metrics. It's a cultural thing — in American fitness culture, doing more is almost always perceived as better. The data disagrees.
Research consistently shows that athletes who monitor and honor recovery metrics improve faster and sustain those improvements longer than those who simply maximize training volume.
Acute-to-Chronic Workload Ratio: Injury Prevention in a Number
This one is used extensively by professional sports organizations — including NFL training staffs and NBA performance teams — but rarely filters down to everyday athletes.
The acute-to-chronic workload ratio (ACWR) compares your recent training load (typically the past week) to your longer-term average load (typically the past four weeks). Research suggests that when your acute load spikes significantly above your chronic baseline — say, you ramp up your mileage dramatically after a rest week — your injury risk increases substantially.
Keeping that ratio in a "sweet spot" range (roughly 0.8 to 1.3 according to most sports science literature) allows you to push hard enough to adapt without crossing into the danger zone.
You can track this manually if you're logging your training load consistently, or look for running and cycling platforms that include workload management tools. TrainingPeaks, for example, surfaces this kind of data in a relatively accessible way.
How to Start Tracking What Actually Matters
You don't need to throw out your current setup or invest in a bunch of new hardware. Start with a few targeted upgrades:
Add a morning HRV check. Spend 60 seconds before you get out of bed measuring your HRV. Log it alongside your training data. After a few weeks, you'll start to see patterns that inform your daily training decisions.
Log subjective recovery scores. On a scale of 1 to 10, how recovered do you feel today? This simple self-reported metric, when tracked consistently, turns out to be a surprisingly strong predictor of performance and injury risk.
Audit your training variety. Look back at the past two weeks of workouts. If your intensity levels look like a flat line, you're likely accumulating monotony. Build in deliberate easy days — not as rest, but as active recovery that keeps your load varied.
Track your training load over rolling windows. Whether you use a platform or a simple spreadsheet, logging weekly training load over time gives you the raw material to calculate your ACWR and catch dangerous spikes before they become injuries.
The Numbers That Build Athletes vs. The Numbers That Build Engagement
Fitness apps are businesses. They're designed to keep you opening the app, which means they optimize for metrics that feel rewarding to check. There's nothing wrong with that — but as an athlete who's serious about long-term progress, you have to go one layer deeper.
The metrics that actually predict athletic longevity, plateau-breaking performance, and sustainable improvement aren't always the ones with the biggest graphics on your home screen. Sometimes they're buried in a settings menu. Sometimes you have to calculate them yourself.
But that's kind of the point. Tracking the metrics that matter takes a little more intention — and that intention is exactly what separates athletes who plateau from athletes who keep climbing.
Every rep tracked. Every result owned. Start with the numbers that actually tell the truth.